파이썬 - 기온데이터 분석(실습)
PYTHON PROGRAMMING
import numpy as np
import pandas as pd
import matplotlib.pyplot as plt
import seaborn as sb

%matplotlib inline

import platform

from matplotlib import font_manager, rc
plt.rcParams['axes.unicode_minus'] = False

if platform.system() == 'Darwin':
    rc('font', family='AppleGothic')
elif platform.system() == 'Windows':
    path = "c:/Windows/Fonts/malgun.ttf"
    font_name = font_manager.FontProperties(fname=path).get_name()
    rc('font', family=font_name)
else:
    print('Unknown system... sorry~~~~')
기온데이터 분석
1907년부터 2018년3월까지의 서울 기온 데이터를 CSV로 다운로드 한다.
- 다운로드 파일을 미리 제공해서 폴더에 넣어두었습니다. seoul.csv 파일을 열어 보세요. encoding=’cp949’
# 기본적으로 언어의 인코딩 방식은 utf-8 방식을 사용한다.
# 그러나 언어 인코딩은 utf-8 말고도 여러 방식이 존재한다.
# 따라서 utf-8 방식이 아닌 방식은, encoding 정보를 명시 해 줘야한다.
df = pd.read_csv('seoul.csv',encoding='cp949')
# 파일 자체를 UTF-8 방식으로 저장 후 불러오기
pd.read_csv('seoul_UTF-8.csv')
| 날짜 | 지점 | 평균기온(℃) | 최저기온(℃) | 최고기온(℃) | |
|---|---|---|---|---|---|
| 0 | 1907-10-01 | 108 | 13.5 | 7.9 | 20.7 |
| 1 | 1907-10-02 | 108 | 16.2 | 7.9 | 22.0 |
| 2 | 1907-10-03 | 108 | 16.2 | 13.1 | 21.3 |
| 3 | 1907-10-04 | 108 | 16.5 | 11.2 | 22.0 |
| 4 | 1907-10-05 | 108 | 17.6 | 10.9 | 25.4 |
| ... | ... | ... | ... | ... | ... |
| 39921 | 2018-03-24 | 108 | 7.6 | 4.0 | 13.1 |
| 39922 | 2018-03-25 | 108 | 9.6 | 4.6 | 16.9 |
| 39923 | 2018-03-26 | 108 | 11.0 | 5.3 | 18.1 |
| 39924 | 2018-03-27 | 108 | 13.3 | 7.7 | 20.0 |
| 39925 | 2018-03-28 | 108 | 14.0 | 9.4 | 19.0 |
39926 rows × 5 columns
실습 1. 가장 더운날은 언제입니까?
df.loc[df['최고기온(℃)'] == df['최고기온(℃)'].max(),'날짜']
31277    1994-07-24
Name: 날짜, dtype: object
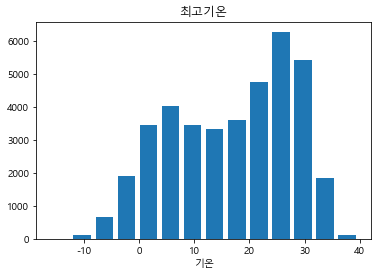
실습 2. 최고기온을 히스토그램으로 나타내되, bin의 범위를 4도로 만들어서, 히스토그램으로 보여주세요.
df['최고기온(℃)'].describe()
count    39168.000000
mean        16.684921
std         10.996621
min        -16.300000
25%          7.100000
50%         18.500000
75%         26.200000
max         38.400000
Name: 최고기온(℃), dtype: float64
my_range = np.arange(-16.3,38.4+4,4)
plt.hist(data= df, x = '최고기온(℃)',rwidth=0.8,bins = my_range)
plt.xlabel('기온')
plt.title('최고기온')
plt.show()
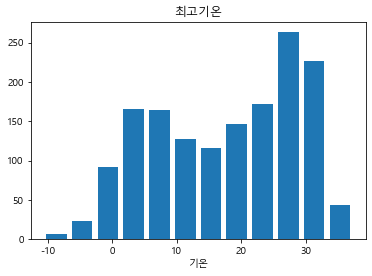
실습 3. 위에서는 모든 날짜에 대한 데이터 입니다. 그러면! 2014년도 부터의 데이터를 기준으로, bin의 범위를 4도로 만들어서, 히스토그램으로 보여주세요.
# 2가지 방법으로 구할 수 있음
df[df['날짜'] == '2014-01-01']
| 날짜 | 지점 | 평균기온(℃) | 최저기온(℃) | 최고기온(℃) | |
|---|---|---|---|---|---|
| 38378 | 2014-01-01 | 108 | 4.0 | 0.3 | 7.9 |
year = df.iloc[38378:,]
year2 = df.set_index("날짜")
year2.loc["2014-01-01":]
| 지점 | 평균기온(℃) | 최저기온(℃) | 최고기온(℃) | |
|---|---|---|---|---|
| 날짜 | ||||
| 2014-01-01 | 108 | 4.0 | 0.3 | 7.9 |
| 2014-01-02 | 108 | 1.5 | -1.3 | 6.2 |
| 2014-01-03 | 108 | 2.3 | -1.1 | 7.3 |
| 2014-01-04 | 108 | -0.1 | -3.7 | 5.6 |
| 2014-01-05 | 108 | -0.8 | -4.3 | 3.8 |
| ... | ... | ... | ... | ... |
| 2018-03-24 | 108 | 7.6 | 4.0 | 13.1 |
| 2018-03-25 | 108 | 9.6 | 4.6 | 16.9 |
| 2018-03-26 | 108 | 11.0 | 5.3 | 18.1 |
| 2018-03-27 | 108 | 13.3 | 7.7 | 20.0 |
| 2018-03-28 | 108 | 14.0 | 9.4 | 19.0 |
1548 rows × 4 columns
year.describe()
| 지점 | 평균기온(℃) | 최저기온(℃) | 최고기온(℃) | |
|---|---|---|---|---|
| count | 1548.0 | 1548.000000 | 1548.000000 | 1547.000000 |
| mean | 108.0 | 12.691667 | 8.537984 | 17.695604 |
| std | 0.0 | 10.849390 | 10.949558 | 11.072697 |
| min | 108.0 | -14.800000 | -18.000000 | -10.700000 |
| 25% | 108.0 | 2.700000 | -1.300000 | 7.450000 |
| 50% | 108.0 | 14.100000 | 9.500000 | 19.500000 |
| 75% | 108.0 | 22.600000 | 18.300000 | 27.800000 |
| max | 108.0 | 31.400000 | 28.700000 | 36.600000 |
my_range = np.arange(-10.7,36.6+4,4)
plt.hist(data= year, x = '최고기온(℃)',rwidth=0.8,bins = my_range)
plt.xlabel('기온')
plt.title('최고기온')
plt.show()
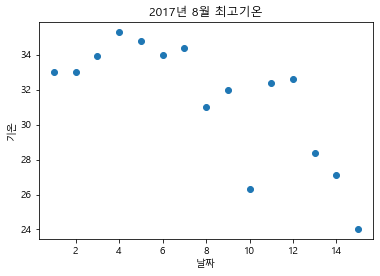
실습 4. 2017-08-01 ~ 2017-08-15 사이의 날짜별 x축, 최고기온을 y축으로 스케터로 나타내세요.
df[df['날짜'] == '2017-08-01']
| 날짜 | 지점 | 평균기온(℃) | 최저기온(℃) | 최고기온(℃) | |
|---|---|---|---|---|---|
| 39686 | 2017-08-01 | 108 | 28.6 | 24.1 | 33.0 |
# copy 함수를 이용하지 않으면 경고문이 뜸.
year_2017 = df.iloc[39686:39686+15,].copy()
year_2017
| 날짜 | 지점 | 평균기온(℃) | 최저기온(℃) | 최고기온(℃) | |
|---|---|---|---|---|---|
| 39686 | 2017-08-01 | 108 | 28.6 | 24.1 | 33.0 |
| 39687 | 2017-08-02 | 108 | 30.0 | 26.6 | 33.0 |
| 39688 | 2017-08-03 | 108 | 30.2 | 27.2 | 33.9 |
| 39689 | 2017-08-04 | 108 | 30.3 | 25.9 | 35.3 |
| 39690 | 2017-08-05 | 108 | 31.4 | 27.6 | 34.8 |
| 39691 | 2017-08-06 | 108 | 29.8 | 28.2 | 34.0 |
| 39692 | 2017-08-07 | 108 | 29.2 | 26.4 | 34.4 |
| 39693 | 2017-08-08 | 108 | 28.2 | 25.5 | 31.0 |
| 39694 | 2017-08-09 | 108 | 27.6 | 24.6 | 32.0 |
| 39695 | 2017-08-10 | 108 | 24.8 | 23.9 | 26.3 |
| 39696 | 2017-08-11 | 108 | 27.0 | 23.9 | 32.4 |
| 39697 | 2017-08-12 | 108 | 27.8 | 23.2 | 32.6 |
| 39698 | 2017-08-13 | 108 | 26.3 | 24.2 | 28.4 |
| 39699 | 2017-08-14 | 108 | 24.6 | 23.1 | 27.1 |
| 39700 | 2017-08-15 | 108 | 21.9 | 20.8 | 24.0 |
year3 = year2.loc["2017-08-01":"2017-08-15"]
year3
| 지점 | 평균기온(℃) | 최저기온(℃) | 최고기온(℃) | |
|---|---|---|---|---|
| 날짜 | ||||
| 2017-08-01 | 108 | 28.6 | 24.1 | 33.0 |
| 2017-08-02 | 108 | 30.0 | 26.6 | 33.0 |
| 2017-08-03 | 108 | 30.2 | 27.2 | 33.9 |
| 2017-08-04 | 108 | 30.3 | 25.9 | 35.3 |
| 2017-08-05 | 108 | 31.4 | 27.6 | 34.8 |
| 2017-08-06 | 108 | 29.8 | 28.2 | 34.0 |
| 2017-08-07 | 108 | 29.2 | 26.4 | 34.4 |
| 2017-08-08 | 108 | 28.2 | 25.5 | 31.0 |
| 2017-08-09 | 108 | 27.6 | 24.6 | 32.0 |
| 2017-08-10 | 108 | 24.8 | 23.9 | 26.3 |
| 2017-08-11 | 108 | 27.0 | 23.9 | 32.4 |
| 2017-08-12 | 108 | 27.8 | 23.2 | 32.6 |
| 2017-08-13 | 108 | 26.3 | 24.2 | 28.4 |
| 2017-08-14 | 108 | 24.6 | 23.1 | 27.1 |
| 2017-08-15 | 108 | 21.9 | 20.8 | 24.0 |
# 인덱스의 값이 날짜이기 때문에 되돌려줘야한다.
year3= year3.reset_index()
year3
| 날짜 | 지점 | 평균기온(℃) | 최저기온(℃) | 최고기온(℃) | |
|---|---|---|---|---|---|
| 0 | 2017-08-01 | 108 | 28.6 | 24.1 | 33.0 |
| 1 | 2017-08-02 | 108 | 30.0 | 26.6 | 33.0 |
| 2 | 2017-08-03 | 108 | 30.2 | 27.2 | 33.9 |
| 3 | 2017-08-04 | 108 | 30.3 | 25.9 | 35.3 |
| 4 | 2017-08-05 | 108 | 31.4 | 27.6 | 34.8 |
| 5 | 2017-08-06 | 108 | 29.8 | 28.2 | 34.0 |
| 6 | 2017-08-07 | 108 | 29.2 | 26.4 | 34.4 |
| 7 | 2017-08-08 | 108 | 28.2 | 25.5 | 31.0 |
| 8 | 2017-08-09 | 108 | 27.6 | 24.6 | 32.0 |
| 9 | 2017-08-10 | 108 | 24.8 | 23.9 | 26.3 |
| 10 | 2017-08-11 | 108 | 27.0 | 23.9 | 32.4 |
| 11 | 2017-08-12 | 108 | 27.8 | 23.2 | 32.6 |
| 12 | 2017-08-13 | 108 | 26.3 | 24.2 | 28.4 |
| 13 | 2017-08-14 | 108 | 24.6 | 23.1 | 27.1 |
| 14 | 2017-08-15 | 108 | 21.9 | 20.8 | 24.0 |
year3['날짜'] = np.arange(1,16)
year_2017['날짜'] = np.arange(1,16)
year_2017
| 날짜 | 지점 | 평균기온(℃) | 최저기온(℃) | 최고기온(℃) | |
|---|---|---|---|---|---|
| 39686 | 1 | 108 | 28.6 | 24.1 | 33.0 |
| 39687 | 2 | 108 | 30.0 | 26.6 | 33.0 |
| 39688 | 3 | 108 | 30.2 | 27.2 | 33.9 |
| 39689 | 4 | 108 | 30.3 | 25.9 | 35.3 |
| 39690 | 5 | 108 | 31.4 | 27.6 | 34.8 |
| 39691 | 6 | 108 | 29.8 | 28.2 | 34.0 |
| 39692 | 7 | 108 | 29.2 | 26.4 | 34.4 |
| 39693 | 8 | 108 | 28.2 | 25.5 | 31.0 |
| 39694 | 9 | 108 | 27.6 | 24.6 | 32.0 |
| 39695 | 10 | 108 | 24.8 | 23.9 | 26.3 |
| 39696 | 11 | 108 | 27.0 | 23.9 | 32.4 |
| 39697 | 12 | 108 | 27.8 | 23.2 | 32.6 |
| 39698 | 13 | 108 | 26.3 | 24.2 | 28.4 |
| 39699 | 14 | 108 | 24.6 | 23.1 | 27.1 |
| 39700 | 15 | 108 | 21.9 | 20.8 | 24.0 |
plt.scatter(data=year_2017 ,x='날짜',y='최고기온(℃)')
plt.title("2017년 8월 최고기온")
plt.xlabel("날짜")
plt.ylabel("기온")
plt.show()
댓글남기기