K-Means 실습
기술 지원 데이터는 종종 고객 경험 개선 기회에 대한 풍부한 정보 소스가 될 수 있습니다. 제품에 대한 고객의 문제가 적을수록 좋습니다. 고객이 최소한의 노력으로 기술적 과제를 신속하게 극복 할 수 있다면 더욱 좋습니다. 기술 지원 데이터를 분석하고 문제 유형, 문제 해결 시간 및 가장 적합한 지원 채널에 대한 기본적인 분석을 수행하겠습니다.
technical_support_data.csv 파일을 통해, 비슷한 유형의 문제들을 도출하시오.
import numpy as np
import pandas as pd
import matplotlib.pyplot as plt
import seaborn as sb

%matplotlib inline

import platform

from matplotlib import font_manager, rc
plt.rcParams['axes.unicode_minus'] = False

if platform.system() == 'Darwin':
    rc('font', family='AppleGothic')
elif platform.system() == 'Windows':
    path = "c:/Windows/Fonts/malgun.ttf"
    font_name = font_manager.FontProperties(fname=path).get_name()
    rc('font', family=font_name)
else:
    print('Unknown system... sorry~~~~')
df = pd.read_csv('technical_support_data.csv')
df.head()
| PROBLEM_TYPE | no_of_cases | Avg_pending_calls | Avg_resol_time | recurrence_freq | Replace_percent | In_warranty_percent | Post_warranty_percent | |
|---|---|---|---|---|---|---|---|---|
| 0 | Temperature control not working | 170 | 1.3 | 32 | 0.04 | 0.0 | 75 | 25 |
| 1 | power chord does not tightly fit | 12 | 2.0 | 150 | 0.01 | 0.5 | 5 | 95 |
| 2 | Fan swing not working | 5 | 1.0 | 35 | 0.02 | 0.2 | 90 | 10 |
| 3 | Main switch does not on | 3 | 2.0 | 8 | 0.01 | 0.7 | 5 | 95 |
| 4 | Forgot mobile app password | 45 | 2.3 | 54 | 0.15 | 0.0 | 99 | 1 |
# Nan 확인
df.isna().sum()
PROBLEM_TYPE             0
no_of_cases              0
Avg_pending_calls        0
Avg_resol_time           0
recurrence_freq          0
Replace_percent          0
In_warranty_percent      0
Post_warranty_percent    0
dtype: int64
X = df.iloc[:,1:]
from sklearn.cluster import KMeans
wcss = []
for k in range(1,11):
    kmeans = KMeans(n_clusters =k, random_state=42)
    # Wcss 값만 확인 할거니까, fit 함수만 이용하면 된다.
    kmeans.fit(X)
    wcss.append(kmeans.inertia_)
C:\Users\5-15\Anaconda3\lib\site-packages\sklearn\cluster\_kmeans.py:881: UserWarning: KMeans is known to have a memory leak on Windows with MKL, when there are less chunks than available threads. You can avoid it by setting the environment variable OMP_NUM_THREADS=1.
  warnings.warn(
plt.plot(range(1,11),wcss)
plt.title('The elbow method')
plt.xlabel('Number of Clusters')
plt.ylabel('WCSS')
plt.show()
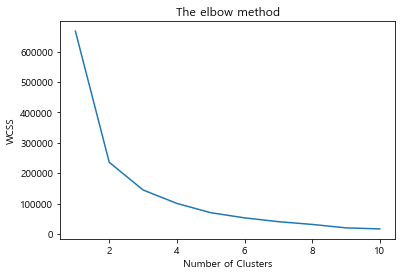
# elbow method, k = 3 적용
kmeans = KMeans(n_clusters=3, random_state=42)
y_pred = kmeans.fit_predict(X)
X['Group'] = y_pred
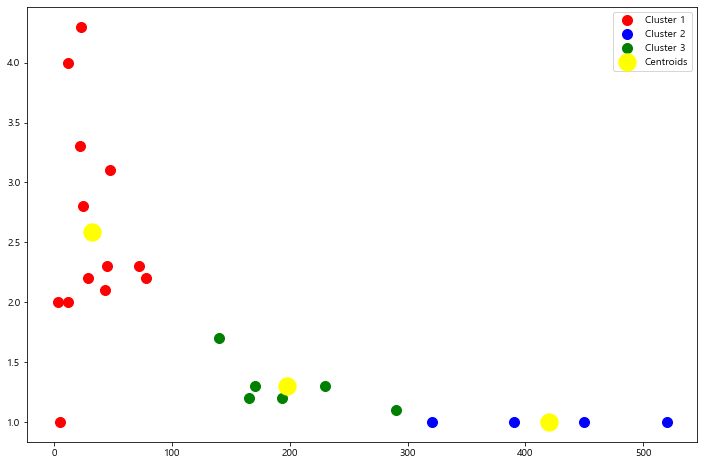
plt.figure(figsize=[12,8])
plt.scatter(X.values[y_pred == 0, 0], X.values[y_pred == 0, 1], s = 100, c = 'red', label = 'Cluster 1')
plt.scatter(X.values[y_pred == 1, 0], X.values[y_pred == 1, 1], s = 100, c = 'blue', label = 'Cluster 2')
plt.scatter(X.values[y_pred == 2, 0], X.values[y_pred == 2, 1], s = 100, c = 'green', label = 'Cluster 3')
plt.scatter(kmeans.cluster_centers_[:, 0], kmeans.cluster_centers_[:, 1], s = 300, c = 'yellow', label = 'Centroids')
plt.legend()
plt.show()
댓글남기기