파이썬 - 범죄 통계 조사
PYTHON PROGRAMMING
레퍼런스 : 파이썬으로 데이터 주무르기
import numpy as np
import pandas as pd
import matplotlib.pyplot as plt
import seaborn as sb

%matplotlib inline

import platform

from matplotlib import font_manager, rc
plt.rcParams['axes.unicode_minus'] = False

if platform.system() == 'Darwin':
    rc('font', family='AppleGothic')
elif platform.system() == 'Windows':
    path = "c:/Windows/Fonts/malgun.ttf"
    font_name = font_manager.FontProperties(fname=path).get_name()
    rc('font', family=font_name)
else:
    print('Unknown system... sorry~~~~')
서울시 구별 범죄 발생과 검거율 데이터 분석
‘서울시 관서별 5대 범죄 발생 검거 현황’ 파일을 가지고 분석합니다.
실습 1. crime_in_Seoul.csv 파일을 pandas 로 읽어오세요.
한글이 깨지지 않도록 encoding=’euc-kr’ 옵션을 넣습니다.
crime_anal_police = pd.read_csv('crime_in_Seoul.csv',encoding='euc-kr',thousands=',')
crime_anal_police.head(3)
| 관서명 | 살인 발생 | 살인 검거 | 강도 발생 | 강도 검거 | 강간 발생 | 강간 검거 | 절도 발생 | 절도 검거 | 폭력 발생 | 폭력 검거 | |
|---|---|---|---|---|---|---|---|---|---|---|---|
| 0 | 중부서 | 2 | 2 | 3 | 2 | 105 | 65 | 1395 | 477 | 1355 | 1170 |
| 1 | 종로서 | 3 | 3 | 6 | 5 | 115 | 98 | 1070 | 413 | 1278 | 1070 |
| 2 | 남대문서 | 1 | 0 | 6 | 4 | 65 | 46 | 1153 | 382 | 869 | 794 |
# 1. 구글에 주소정보를 받기 위한 API key를 얻습니다.

# 2. 우리가 짜는 파이썬 코드에서, API를 호출하기 위한 라이브러리를 설치합니다.
#    2-1 Anaconda Prompt 를 실행합니다.
#    2-2 라이브러리 인스톨을 위한 명령어를 수행합니다.
#        pip install googlemaps
실습 2. 경찰서들은 하나의 구에 여러개가 있을 수 있습니다. 따라서 우리는 구 단위로 데이터를 통합하겠습니다.
실습 2-1. 구글 맵 API 를 이용해서, 경찰서가 무슨 구에 있는지 확인하기 위해
아나콘다 프롬프트웨어 다음을 실행. pip install googlemaps
실습 2-2. 구글 클라우드의 MAPS API 페이지로 이동하여, API 키를 생성합니다.
https://cloud.google.com/maps-platform/?hl=ko
콘솔로 이동 => Geocoding API 선택 => 사용자인증정보 에서 API 키 생성
- 구글 맵스를 사용해서 경찰서의 위치(위도, 경도) 정보를 받아온다
import googlemaps
gmaps_key = "my_key" # 자신의 key를 사용합니다.
gmaps = googlemaps.Client(key=gmaps_key)
gmaps.geocode('서울중부경찰서', language='ko')
[{'address_components': [{'long_name': '27',
    'short_name': '27',
    'types': ['premise']},
   {'long_name': '수표로',
    'short_name': '수표로',
    'types': ['political', 'sublocality', 'sublocality_level_4']},
   {'long_name': '을지로동',
    'short_name': '을지로동',
    'types': ['political', 'sublocality', 'sublocality_level_2']},
   {'long_name': '중구',
    'short_name': '중구',
    'types': ['political', 'sublocality', 'sublocality_level_1']},
   {'long_name': '서울특별시',
    'short_name': '서울특별시',
    'types': ['administrative_area_level_1', 'political']},
   {'long_name': '대한민국',
    'short_name': 'KR',
    'types': ['country', 'political']},
   {'long_name': '100-032',
    'short_name': '100-032',
    'types': ['postal_code']}],
  'formatted_address': '대한민국 서울특별시 중구 을지로동 수표로 27',
  'geometry': {'location': {'lat': 37.5636465, 'lng': 126.9895796},
   'location_type': 'ROOFTOP',
   'viewport': {'northeast': {'lat': 37.56499548029149,
     'lng': 126.9909285802915},
    'southwest': {'lat': 37.56229751970849, 'lng': 126.9882306197085}}},
  'place_id': 'ChIJc-9q5uSifDURLhQmr5wkXmc',
  'plus_code': {'compound_code': 'HX7Q+FR 대한민국 서울특별시',
   'global_code': '8Q98HX7Q+FR'},
  'types': ['establishment', 'point_of_interest', 'police']}]
# 정확한 지명으로 붜꿔서 , api를 호출해야 결과가 정확히 떄문에
# 관서명 컬럼에 있는 값들을, 왼쪽에는 서울을 붙이고 오른쪽에는 경찰서를 붙인다.
police_names = []
for name in crime_anal_police['관서명']:
    police_names.append('서울'+ name[:-1]+'경찰서')
print(police_names)
['서울중부경찰서', '서울종로경찰서', '서울남대문경찰서', '서울서대문경찰서', '서울혜화경찰서', '서울용산경찰서', '서울성북경찰서', '서울동대문경찰서', '서울마포경찰서', '서울영등포경찰서', '서울성동경찰서', '서울동작경찰서', '서울광진경찰서', '서울서부경찰서', '서울강북경찰서', '서울금천경찰서', '서울중랑경찰서', '서울강남경찰서', '서울관악경찰서', '서울강서경찰서', '서울강동경찰서', '서울종암경찰서', '서울구로경찰서', '서울서초경찰서', '서울양천경찰서', '서울송파경찰서', '서울노원경찰서', '서울방배경찰서', '서울은평경찰서', '서울도봉경찰서', '서울수서경찰서']
# 구글 api를 호출해서 결과를 받아옴
# 우리가 필요한 건 전체 주소가 나와있는 문자열이다.
# 따라서 구글 api의 결과로 온  JSON 데이터에서
# 어느 부분을 가져올지 파악한다.
result = [{'address_components': [{'long_name': '27',
    'short_name': '27',
    'types': ['premise']},
   {'long_name': '수표로',
    'short_name': '수표로',
    'types': ['political', 'sublocality', 'sublocality_level_4']},
   {'long_name': '을지로동',
    'short_name': '을지로동',
    'types': ['political', 'sublocality', 'sublocality_level_2']},
   {'long_name': '중구',
    'short_name': '중구',
    'types': ['political', 'sublocality', 'sublocality_level_1']},
   {'long_name': '서울특별시',
    'short_name': '서울특별시',
    'types': ['administrative_area_level_1', 'political']},
   {'long_name': '대한민국',
    'short_name': 'KR',
    'types': ['country', 'political']},
   {'long_name': '100-032',
    'short_name': '100-032',
    'types': ['postal_code']}],
  'formatted_address': '대한민국 서울특별시 중구 을지로동 수표로 27',
  'geometry': {'location': {'lat': 37.5636465, 'lng': 126.9895796},
   'location_type': 'ROOFTOP',
   'viewport': {'northeast': {'lat': 37.56499548029149,
     'lng': 126.9909285802915},
    'southwest': {'lat': 37.56229751970849, 'lng': 126.9882306197085}}},
  'place_id': 'ChIJc-9q5uSifDURLhQmr5wkXmc',
  'plus_code': {'compound_code': 'HX7Q+FR 대한민국 서울특별시',
   'global_code': '8Q98HX7Q+FR'},
  'types': ['establishment', 'point_of_interest', 'police']}]
result_station = result[0]['formatted_address'].split()[2]
result_station = []
for police in police_names:
    result = gmaps.geocode(police, language = 'ko')
    result_station.append(result[0]['formatted_address'].split()[2])
실습 3. station_addreess 에 저장된 주소에서, 구만 따로 띄어냅니다. (예, 종로구)
따로 띄어낸 구를, crime_anal_police 에 ‘구별’ 컬럼을 만들어서 넣습니다.
crime_anal_police['구별'] = result_station
crime_anal_police.set_index('구별',inplace = True)
crime_anal_police.head()
| 관서명 | 살인 발생 | 살인 검거 | 강도 발생 | 강도 검거 | 강간 발생 | 강간 검거 | 절도 발생 | 절도 검거 | 폭력 발생 | 폭력 검거 | |
|---|---|---|---|---|---|---|---|---|---|---|---|
| 구별 | |||||||||||
| 중구 | 중부서 | 2 | 2 | 3 | 2 | 105 | 65 | 1395 | 477 | 1355 | 1170 |
| 종로구 | 종로서 | 3 | 3 | 6 | 5 | 115 | 98 | 1070 | 413 | 1278 | 1070 |
| 중구 | 남대문서 | 1 | 0 | 6 | 4 | 65 | 46 | 1153 | 382 | 869 | 794 |
| 서대문구 | 서대문서 | 2 | 2 | 5 | 4 | 154 | 124 | 1812 | 738 | 2056 | 1711 |
| 종로구 | 혜화서 | 3 | 2 | 5 | 4 | 96 | 63 | 1114 | 424 | 1015 | 861 |
.실습 3. crime_anal_police 데이터프레임을, csv 파일로 저장합니다.
저장할 파일명은 new_crime_in_Seoul.csv 로 저장하세요.
저장하는 함수는, 데이터프레임의 to_csv 입니다.
crime_anal_police.to_csv('new_crime_in_Seoul')
new_crime_in_Seoul = pd.read_csv('new_crime_in_Seoul.csv',index_col = 0)
new_crime_in_Seoul.set_index('구별',inplace=True)
pandas의 pivot_table 익히기
# 피봇팅 한다. 즉 컬럼의 값을 열로 만드는것.
df = pd.read_excel('sales-funnel.xlsx')
df
| Account | Name | Rep | Manager | Product | Quantity | Price | Status | |
|---|---|---|---|---|---|---|---|---|
| 0 | 714466 | Trantow-Barrows | Craig Booker | Debra Henley | CPU | 1 | 30000 | presented |
| 1 | 714466 | Trantow-Barrows | Craig Booker | Debra Henley | Software | 1 | 10000 | presented |
| 2 | 714466 | Trantow-Barrows | Craig Booker | Debra Henley | Maintenance | 2 | 5000 | pending |
| 3 | 737550 | Fritsch, Russel and Anderson | Craig Booker | Debra Henley | CPU | 1 | 35000 | declined |
| 4 | 146832 | Kiehn-Spinka | Daniel Hilton | Debra Henley | CPU | 2 | 65000 | won |
| 5 | 218895 | Kulas Inc | Daniel Hilton | Debra Henley | CPU | 2 | 40000 | pending |
| 6 | 218895 | Kulas Inc | Daniel Hilton | Debra Henley | Software | 1 | 10000 | presented |
| 7 | 412290 | Jerde-Hilpert | John Smith | Debra Henley | Maintenance | 2 | 5000 | pending |
| 8 | 740150 | Barton LLC | John Smith | Debra Henley | CPU | 1 | 35000 | declined |
| 9 | 141962 | Herman LLC | Cedric Moss | Fred Anderson | CPU | 2 | 65000 | won |
| 10 | 163416 | Purdy-Kunde | Cedric Moss | Fred Anderson | CPU | 1 | 30000 | presented |
| 11 | 239344 | Stokes LLC | Cedric Moss | Fred Anderson | Maintenance | 1 | 5000 | pending |
| 12 | 239344 | Stokes LLC | Cedric Moss | Fred Anderson | Software | 1 | 10000 | presented |
| 13 | 307599 | Kassulke, Ondricka and Metz | Wendy Yule | Fred Anderson | Maintenance | 3 | 7000 | won |
| 14 | 688981 | Keeling LLC | Wendy Yule | Fred Anderson | CPU | 5 | 100000 | won |
| 15 | 729833 | Koepp Ltd | Wendy Yule | Fred Anderson | CPU | 2 | 65000 | declined |
| 16 | 729833 | Koepp Ltd | Wendy Yule | Fred Anderson | Monitor | 2 | 5000 | presented |
pd.pivot_table(df,index = ['Name'],aggfunc=np.sum)
| Account | Price | Quantity | |
|---|---|---|---|
| Name | |||
| Barton LLC | 740150 | 35000 | 1 |
| Fritsch, Russel and Anderson | 737550 | 35000 | 1 |
| Herman LLC | 141962 | 65000 | 2 |
| Jerde-Hilpert | 412290 | 5000 | 2 |
| Kassulke, Ondricka and Metz | 307599 | 7000 | 3 |
| Keeling LLC | 688981 | 100000 | 5 |
| Kiehn-Spinka | 146832 | 65000 | 2 |
| Koepp Ltd | 1459666 | 70000 | 4 |
| Kulas Inc | 437790 | 50000 | 3 |
| Purdy-Kunde | 163416 | 30000 | 1 |
| Stokes LLC | 478688 | 15000 | 2 |
| Trantow-Barrows | 2143398 | 45000 | 4 |
pd.pivot_table(df,index = ['Manager','Rep'], aggfunc = np.sum )
| Account | Price | Quantity | ||
|---|---|---|---|---|
| Manager | Rep | |||
| Debra Henley | Craig Booker | 2880948 | 80000 | 5 |
| Daniel Hilton | 584622 | 115000 | 5 | |
| John Smith | 1152440 | 40000 | 3 | |
| Fred Anderson | Cedric Moss | 784066 | 110000 | 5 |
| Wendy Yule | 2456246 | 177000 | 12 |
pd.pivot_table(df,index = ['Name'],aggfunc=np.sum,values=['Price','Quantity'])
| Price | Quantity | |
|---|---|---|
| Name | ||
| Barton LLC | 35000 | 1 |
| Fritsch, Russel and Anderson | 35000 | 1 |
| Herman LLC | 65000 | 2 |
| Jerde-Hilpert | 5000 | 2 |
| Kassulke, Ondricka and Metz | 7000 | 3 |
| Keeling LLC | 100000 | 5 |
| Kiehn-Spinka | 65000 | 2 |
| Koepp Ltd | 70000 | 4 |
| Kulas Inc | 50000 | 3 |
| Purdy-Kunde | 30000 | 1 |
| Stokes LLC | 15000 | 2 |
| Trantow-Barrows | 45000 | 4 |
범죄 데이터 구별로 정리하기
crime_anal = pd.pivot_table(crime_anal_police,index='구별',aggfunc = np.sum)
crime_anal.head()
| 강간 검거 | 강간 발생 | 강도 검거 | 강도 발생 | 살인 검거 | 살인 발생 | 절도 검거 | 절도 발생 | 폭력 검거 | 폭력 발생 | |
|---|---|---|---|---|---|---|---|---|---|---|
| 구별 | ||||||||||
| 강남구 | 349 | 449 | 18 | 21 | 10 | 13 | 1650 | 3850 | 3705 | 4284 |
| 강동구 | 123 | 156 | 8 | 6 | 3 | 4 | 789 | 2366 | 2248 | 2712 |
| 강북구 | 126 | 153 | 13 | 14 | 8 | 7 | 618 | 1434 | 2348 | 2649 |
| 관악구 | 221 | 320 | 14 | 12 | 8 | 9 | 827 | 2706 | 2642 | 3298 |
| 광진구 | 220 | 240 | 26 | 14 | 4 | 4 | 1277 | 3026 | 2180 | 2625 |
실습 5. ‘강간검거율’ , ‘강도검거율’, ‘살인검거율’, ‘절도검거율’, ‘폭력검거율’ 을 계산하여, crime_anal에 각 컬럼을 추가한다. ( 검거율은 * 100 까지 한 값)
crime_anal['절도검거율'] = crime_anal['절도 검거']/crime_anal['절도 발생'] * 100
crime_anal['강간검거율'] = crime_anal['강간 검거']/crime_anal['강간 발생'] * 100
crime_anal['강도검거율'] = crime_anal['강도 검거']/crime_anal['강도 발생'] * 100
crime_anal['살인검거율'] = crime_anal['살인 검거']/crime_anal['살인 발생'] * 100
crime_anal['폭력검거율'] = crime_anal['폭력 검거']/crime_anal['폭력 발생'] * 100
실습 6. 이제 필요없는, ‘강간 검거’ , ‘강도 검거’, ‘살인 검거’, ‘절도 검거’, ‘폭력 검거’ 컬럼을 제거한다.
crime_anal.drop(['강간 검거' , '강도 검거', '살인 검거', '절도 검거', '폭력 검거'],axis = 1,inplace=True)
crime_anal.head()
| 강간 발생 | 강도 발생 | 살인 발생 | 절도 발생 | 폭력 발생 | 절도검거율 | 강간검거율 | 강도검거율 | 살인검거율 | 폭력검거율 | |
|---|---|---|---|---|---|---|---|---|---|---|
| 구별 | ||||||||||
| 강남구 | 449 | 21 | 13 | 3850 | 4284 | 42.857143 | 77.728285 | 85.714286 | 76.923077 | 86.484594 |
| 강동구 | 156 | 6 | 4 | 2366 | 2712 | 33.347422 | 78.846154 | 100.000000 | 75.000000 | 82.890855 |
| 강북구 | 153 | 14 | 7 | 1434 | 2649 | 43.096234 | 82.352941 | 92.857143 | 100.000000 | 88.637222 |
| 관악구 | 320 | 12 | 9 | 2706 | 3298 | 30.561715 | 69.062500 | 100.000000 | 88.888889 | 80.109157 |
| 광진구 | 240 | 14 | 4 | 3026 | 2625 | 42.200925 | 91.666667 | 100.000000 | 100.000000 | 83.047619 |
실습 7. describe() 함수로 값을 확인해 보니, 검거율이 100 이상인 경우도 있다. 따라서 100보다 크면, 100으로 값을 셋팅하세요.
crime_anal.loc[crime_anal['절도검거율']>100, '절도검거율'] = 100
crime_anal.loc[crime_anal['강도검거율']>100, '강도검거율'] = 100
crime_anal.loc[crime_anal['강간검거율']>100, '강간검거율'] = 100
crime_anal.loc[crime_anal['살인검거율']>100, '살인검거율'] = 100
crime_anal.loc[crime_anal['폭력검거율']>100, '폭력검거율'] = 100
실습 8. 강간 발생, 강도 발생, 살인 발생, 절도 발생, 폭력 발생 의 컬럼 명을, 강간, 강도, 살인, 절도, 폭력으로 rename 하세요.
crime_anal.columns = ['강간', '강도', '살인', '절도', '폭력', '절도검거율', '폭력검거율', '강간검거율',
       '강도검거율', '살인검거율']
crime_anal
| 강간 | 강도 | 살인 | 절도 | 폭력 | 절도검거율 | 폭력검거율 | 강간검거율 | 강도검거율 | 살인검거율 | |
|---|---|---|---|---|---|---|---|---|---|---|
| 구별 | ||||||||||
| 강남구 | 449 | 21 | 13 | 3850 | 4284 | 42.857143 | 77.728285 | 85.714286 | 76.923077 | 86.484594 |
| 강동구 | 156 | 6 | 4 | 2366 | 2712 | 33.347422 | 78.846154 | 100.000000 | 75.000000 | 82.890855 |
| 강북구 | 153 | 14 | 7 | 1434 | 2649 | 43.096234 | 82.352941 | 92.857143 | 100.000000 | 88.637222 |
| 관악구 | 320 | 12 | 9 | 2706 | 3298 | 30.561715 | 69.062500 | 100.000000 | 88.888889 | 80.109157 |
| 광진구 | 240 | 14 | 4 | 3026 | 2625 | 42.200925 | 91.666667 | 100.000000 | 100.000000 | 83.047619 |
| 구로구 | 281 | 15 | 8 | 2335 | 3007 | 38.072805 | 58.362989 | 73.333333 | 75.000000 | 80.877951 |
| 금천구 | 151 | 6 | 3 | 1567 | 2054 | 56.668794 | 80.794702 | 100.000000 | 100.000000 | 86.465433 |
| 노원구 | 197 | 7 | 10 | 2193 | 2723 | 36.525308 | 61.421320 | 100.000000 | 100.000000 | 85.530665 |
| 도봉구 | 102 | 9 | 3 | 1063 | 1487 | 44.967074 | 100.000000 | 100.000000 | 100.000000 | 87.626093 |
| 동대문구 | 173 | 13 | 5 | 1981 | 2548 | 41.090358 | 84.393064 | 100.000000 | 100.000000 | 87.401884 |
| 동작구 | 285 | 9 | 5 | 1865 | 1910 | 35.442359 | 48.771930 | 55.555556 | 100.000000 | 83.089005 |
| 마포구 | 294 | 14 | 8 | 2555 | 2983 | 31.819961 | 84.013605 | 71.428571 | 100.000000 | 84.445189 |
| 서대문구 | 154 | 5 | 2 | 1812 | 2056 | 40.728477 | 80.519481 | 80.000000 | 100.000000 | 83.219844 |
| 서초구 | 393 | 9 | 8 | 2635 | 2399 | 41.404175 | 63.358779 | 66.666667 | 75.000000 | 87.453105 |
| 성동구 | 126 | 9 | 4 | 1607 | 1612 | 37.149969 | 94.444444 | 88.888889 | 100.000000 | 86.538462 |
| 성북구 | 150 | 5 | 5 | 1785 | 2209 | 41.512605 | 82.666667 | 80.000000 | 100.000000 | 83.974649 |
| 송파구 | 220 | 13 | 11 | 3239 | 3295 | 34.856437 | 80.909091 | 76.923077 | 90.909091 | 84.552352 |
| 양천구 | 382 | 19 | 10 | 3986 | 5716 | 48.469644 | 77.486911 | 84.210526 | 100.000000 | 83.065080 |
| 영등포구 | 295 | 22 | 14 | 2964 | 3572 | 32.995951 | 62.033898 | 90.909091 | 85.714286 | 82.894737 |
| 용산구 | 194 | 14 | 5 | 1557 | 2050 | 37.700706 | 89.175258 | 100.000000 | 100.000000 | 83.121951 |
| 은평구 | 166 | 9 | 3 | 1914 | 2653 | 37.147335 | 84.939759 | 66.666667 | 100.000000 | 86.920467 |
| 종로구 | 211 | 11 | 6 | 2184 | 2293 | 38.324176 | 76.303318 | 81.818182 | 83.333333 | 84.212822 |
| 중구 | 170 | 9 | 3 | 2548 | 2224 | 33.712716 | 65.294118 | 66.666667 | 66.666667 | 88.309353 |
| 중랑구 | 187 | 11 | 13 | 2135 | 2847 | 38.829040 | 79.144385 | 81.818182 | 92.307692 | 84.545135 |
.실습 9. 강간, 강도, 살인, 절도, 폭력 을 노멀라이징 합니다.
데이터 노멀라이징 하는 이유는, 각각의 레인지를 통일하여, 해석하기 쉽게 하기 위함입니다.
from sklearn.preprocessing import StandardScaler,MinMaxScaler
# 표준화 하는 라이브러리
s_scaler = StandardScaler()
# 표준화 하는 함수
# 각 컬럼의 평균과 표준편차를 학습하여, 표준화 식을 통해 결과를 변환하는 함수
crime_anal.loc[:,"강간":"폭력"] = MinMaxScaler().fit_transform(crime_anal.loc[:,"강간":"폭력"])
mm_scaler = MinMaxScaler()
crime_anal.describe()
| 강간 | 강도 | 살인 | 절도 | 폭력 | 절도검거율 | 폭력검거율 | 강간검거율 | 강도검거율 | 살인검거율 | |
|---|---|---|---|---|---|---|---|---|---|---|
| count | 24.000000 | 24.000000 | 24.000000 | 24.000000 | 24.000000 | 24.000000 | 24.000000 | 24.000000 | 24.000000 | 24.000000 |
| mean | 0.360351 | 0.382353 | 0.399306 | 0.424721 | 0.290829 | 39.145055 | 77.237094 | 85.144035 | 92.072626 | 84.808901 |
| std | 0.263464 | 0.274814 | 0.297919 | 0.250679 | 0.212406 | 5.759176 | 12.285098 | 13.583076 | 10.949588 | 2.310261 |
| min | 0.000000 | 0.000000 | 0.000000 | 0.000000 | 0.000000 | 30.561715 | 48.771930 | 55.555556 | 66.666667 | 80.109157 |
| 25% | 0.154179 | 0.235294 | 0.166667 | 0.253934 | 0.161681 | 35.295879 | 68.120404 | 76.025641 | 85.119048 | 83.083024 |
| 50% | 0.269452 | 0.352941 | 0.291667 | 0.385050 | 0.271932 | 38.198490 | 79.831933 | 84.962406 | 100.000000 | 84.495162 |
| 75% | 0.533862 | 0.529412 | 0.604167 | 0.543876 | 0.355167 | 41.684685 | 84.108470 | 100.000000 | 100.000000 | 86.633963 |
| max | 1.000000 | 1.000000 | 1.000000 | 1.000000 | 1.000000 | 56.668794 | 100.000000 | 100.000000 | 100.000000 | 88.637222 |
실습 10. 강간, 강도, 살인, 절도, 폭력 의 값을 모두 더하고, 이 더한값을 ‘범죄’ 라는 컬럼을 만들어서 넣습니다.
CCTV_result= pd.read_csv('CCTV_result.csv')
CCTV_result.set_index('구별',inplace = True)
CCTV_result.rename(columns={'소계':'CCTV'},inplace = True)
pop_cctv= CCTV_result[['CCTV','인구수']]
crime_cctv = pd.merge(crime_anal,pop_cctv,on='구별')
crime_cctv['범죄']= crime_cctv.loc[:,'강간':'폭력'].sum(axis=1)
crime_cctv.head(3)
| 강간 | 강도 | 살인 | 절도 | 폭력 | 절도검거율 | 폭력검거율 | 강간검거율 | 강도검거율 | 살인검거율 | CCTV | 인구수 | 범죄 | |
|---|---|---|---|---|---|---|---|---|---|---|---|---|---|
| 구별 | |||||||||||||
| 강남구 | 1.000000 | 0.941176 | 0.916667 | 0.953472 | 0.661386 | 42.857143 | 77.728285 | 85.714286 | 76.923077 | 86.484594 | 2780 | 570500.0 | 4.472701 |
| 강동구 | 0.155620 | 0.058824 | 0.166667 | 0.445775 | 0.289667 | 33.347422 | 78.846154 | 100.000000 | 75.000000 | 82.890855 | 773 | 453233.0 | 1.116551 |
| 강북구 | 0.146974 | 0.529412 | 0.416667 | 0.126924 | 0.274769 | 43.096234 | 82.352941 | 92.857143 | 100.000000 | 88.637222 | 748 | 330192.0 | 1.494746 |
실습 11. ‘강간검거율’,’강도검거율’,’살인검거율’,’절도검거율’,’폭력검거율’ 의 값을 모두 더하고, 이 더한값을 ‘검거’ 라는 컬럼을 만들어서 넣습니다.
crime_cctv['검거']= crime_cctv.loc[:,'절도검거율':'살인검거율'].sum(axis=1)
crime_cctv.head()
| 강간 | 강도 | 살인 | 절도 | 폭력 | 절도검거율 | 폭력검거율 | 강간검거율 | 강도검거율 | 살인검거율 | CCTV | 인구수 | 범죄 | 검거 | |
|---|---|---|---|---|---|---|---|---|---|---|---|---|---|---|
| 구별 | ||||||||||||||
| 강남구 | 1.000000 | 0.941176 | 0.916667 | 0.953472 | 0.661386 | 42.857143 | 77.728285 | 85.714286 | 76.923077 | 86.484594 | 2780 | 570500.0 | 4.472701 | 369.707384 |
| 강동구 | 0.155620 | 0.058824 | 0.166667 | 0.445775 | 0.289667 | 33.347422 | 78.846154 | 100.000000 | 75.000000 | 82.890855 | 773 | 453233.0 | 1.116551 | 370.084431 |
| 강북구 | 0.146974 | 0.529412 | 0.416667 | 0.126924 | 0.274769 | 43.096234 | 82.352941 | 92.857143 | 100.000000 | 88.637222 | 748 | 330192.0 | 1.494746 | 406.943540 |
| 관악구 | 0.628242 | 0.411765 | 0.583333 | 0.562094 | 0.428234 | 30.561715 | 69.062500 | 100.000000 | 88.888889 | 80.109157 | 1496 | 525515.0 | 2.613667 | 368.622261 |
| 광진구 | 0.397695 | 0.529412 | 0.166667 | 0.671570 | 0.269094 | 42.200925 | 91.666667 | 100.000000 | 100.000000 | 83.047619 | 707 | 372164.0 | 2.034438 | 416.915211 |
Visualization using seaborn
# 한글 그래프 처리 코드 실행
import numpy as np
import pandas as pd
import matplotlib.pyplot as plt
import seaborn as sb

%matplotlib inline

import platform

from matplotlib import font_manager, rc
plt.rcParams['axes.unicode_minus'] = False

if platform.system() == 'Darwin':
    rc('font', family='AppleGothic')
elif platform.system() == 'Windows':
    path = "c:/Windows/Fonts/malgun.ttf"
    font_name = font_manager.FontProperties(fname=path).get_name()
    rc('font', family=font_name)
else:
    print('Unknown system... sorry~~~~')
실습 12. sb의 pairplot 으로 “강도”, “살인”, “폭력” 을 나타내세요. (연관성 확인)
sb.pairplot(data = crime_cctv[['강도','살인','폭력']])

plt.show()
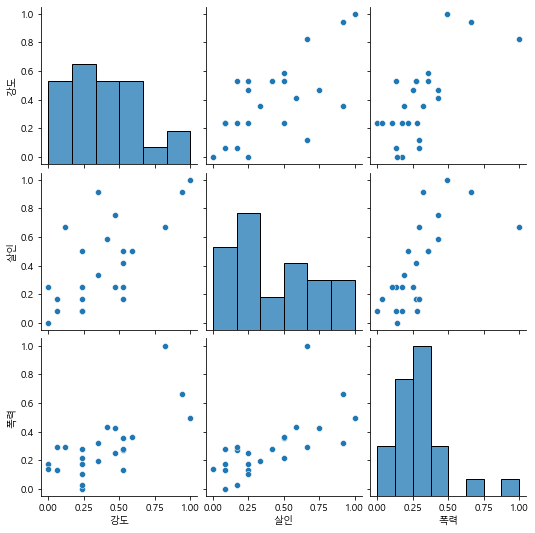
sb.pairplot(data = crime_cctv, vars=['강도','살인','폭력'],kind='reg')

plt.show()
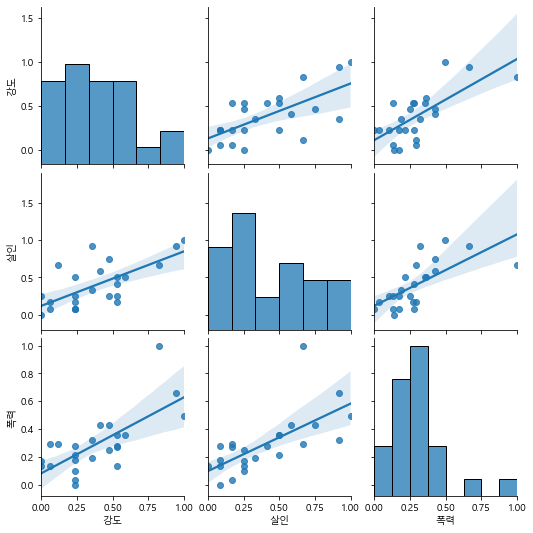
crime_cctv[['강도','살인','폭력']].corr()
| 강도 | 살인 | 폭력 | |
|---|---|---|---|
| 강도 | 1.000000 | 0.672924 | 0.707703 |
| 살인 | 0.672924 | 1.000000 | 0.681428 |
| 폭력 | 0.707703 | 0.681428 | 1.000000 |
실습 13. x_vars는 “인구수”, “CCTV” 를, y_vars는 “살인”, “강도”로 pariplot을 나타내고, 연관성을 확인하세요.
sb.pairplot(data= crime_cctv,x_vars = ['인구수','CCTV'],y_vars = ['살인','강도'],kind='reg')

plt.show()
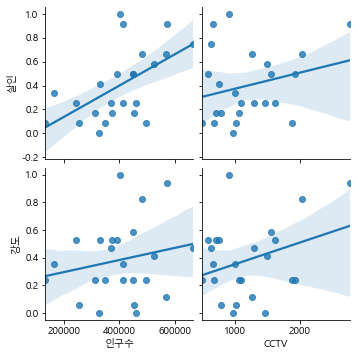
crime_cctv[['인구수','CCTV','살인','강도']].corr()
| 인구수 | CCTV | 살인 | 강도 | |
|---|---|---|---|---|
| 인구수 | 1.000000 | 0.361204 | 0.555986 | 0.201035 |
| CCTV | 0.361204 | 1.000000 | 0.253698 | 0.320451 |
| 살인 | 0.555986 | 0.253698 | 1.000000 | 0.672924 |
| 강도 | 0.201035 | 0.320451 | 0.672924 | 1.000000 |
실습 14. x_vars는 “인구수”, “CCTV” 를, y_vars는 “살인검거율”, “폭력검거율”로 pariplot을 나타내고, 연관성을 확인하세요.
sb.pairplot(data= crime_cctv,x_vars = ['인구수','CCTV'],y_vars = ['살인검거율','폭력검거율'],kind='reg')

plt.show()
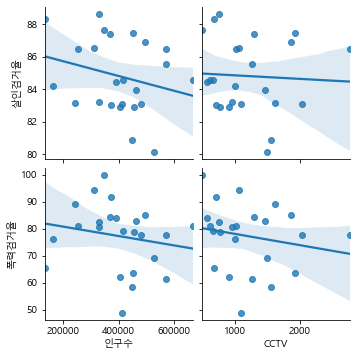
crime_cctv[['인구수','CCTV','살인검거율','폭력검거율']].corr()
| 인구수 | CCTV | 살인검거율 | 폭력검거율 | |
|---|---|---|---|---|
| 인구수 | 1.000000 | 0.361204 | -0.249549 | -0.179233 |
| CCTV | 0.361204 | 1.000000 | -0.053107 | -0.191364 |
| 살인검거율 | -0.249549 | -0.053107 | 1.000000 | 0.296559 |
| 폭력검거율 | -0.179233 | -0.191364 | 0.296559 | 1.000000 |
실습 15. x_vars는 “인구수”, “CCTV” 를, y_vars는 “절도검거율”, “강도검거율”로 pariplot을 나타내고, 연관성을 확인하세요.
sb.pairplot(data= crime_cctv,x_vars = ['인구수','CCTV'],y_vars = ['절도검거율','강도검거율'],kind='reg')

plt.show()
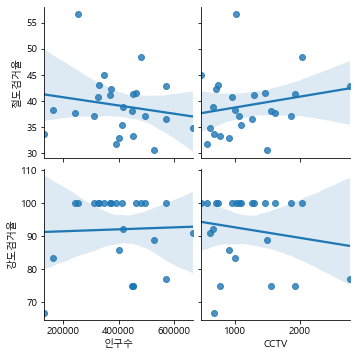
crime_cctv[['인구수','CCTV','절도검거율','강도검거율']].corr()
| 인구수 | CCTV | 절도검거율 | 강도검거율 | |
|---|---|---|---|---|
| 인구수 | 1.000000 | 0.361204 | -0.173292 | 0.034423 |
| CCTV | 0.361204 | 1.000000 | 0.203458 | -0.164280 |
| 절도검거율 | -0.173292 | 0.203458 | 1.000000 | 0.309570 |
| 강도검거율 | 0.034423 | -0.164280 | 0.309570 | 1.000000 |
실습 16. 검거가 가장 높은 구는 어디입니까? 이를 확인하기 위해, 검거가 가장 높은 구부터 정렬하여 5개의 구까지 나타내세요.
crime_cctv.sort_values('검거',ascending=False,inplace=True)
crime_cctv.head(5)
| 강간 | 강도 | 살인 | 절도 | 폭력 | 절도검거율 | 폭력검거율 | 강간검거율 | 강도검거율 | 살인검거율 | CCTV | 인구수 | 범죄 | 검거 | |
|---|---|---|---|---|---|---|---|---|---|---|---|---|---|---|
| 구별 | ||||||||||||||
| 도봉구 | 0.000000 | 0.235294 | 0.083333 | 0.000000 | 0.000000 | 44.967074 | 100.000000 | 100.0 | 100.0 | 87.626093 | 485 | 348646.0 | 0.318627 | 432.593167 |
| 금천구 | 0.141210 | 0.058824 | 0.083333 | 0.172426 | 0.134074 | 56.668794 | 80.794702 | 100.0 | 100.0 | 86.465433 | 1015 | 255082.0 | 0.589867 | 423.928929 |
| 광진구 | 0.397695 | 0.529412 | 0.166667 | 0.671570 | 0.269094 | 42.200925 | 91.666667 | 100.0 | 100.0 | 83.047619 | 707 | 372164.0 | 2.034438 | 416.915211 |
| 동대문구 | 0.204611 | 0.470588 | 0.250000 | 0.314061 | 0.250887 | 41.090358 | 84.393064 | 100.0 | 100.0 | 87.401884 | 1294 | 369496.0 | 1.490147 | 412.885306 |
| 용산구 | 0.265130 | 0.529412 | 0.250000 | 0.169004 | 0.133128 | 37.700706 | 89.175258 | 100.0 | 100.0 | 83.121951 | 1624 | 244203.0 | 1.346674 | 409.997915 |
실습 17. 검거가 가장 큰값이 432.593167 입니다. 검거의 값이 최대가 100이 되도록 정규화를 하세요. 그리고 검거값으로 정렬하세요.
crime_cctv['검거']= crime_cctv['검거'] / crime_cctv['검거'].max() * 100
crime_cctv.head()
| 강간 | 강도 | 살인 | 절도 | 폭력 | 절도검거율 | 폭력검거율 | 강간검거율 | 강도검거율 | 살인검거율 | CCTV | 인구수 | 범죄 | 검거 | |
|---|---|---|---|---|---|---|---|---|---|---|---|---|---|---|
| 구별 | ||||||||||||||
| 도봉구 | 0.000000 | 0.235294 | 0.083333 | 0.000000 | 0.000000 | 44.967074 | 100.000000 | 100.0 | 100.0 | 87.626093 | 485 | 348646.0 | 0.318627 | 100.000000 |
| 금천구 | 0.141210 | 0.058824 | 0.083333 | 0.172426 | 0.134074 | 56.668794 | 80.794702 | 100.0 | 100.0 | 86.465433 | 1015 | 255082.0 | 0.589867 | 97.997139 |
| 광진구 | 0.397695 | 0.529412 | 0.166667 | 0.671570 | 0.269094 | 42.200925 | 91.666667 | 100.0 | 100.0 | 83.047619 | 707 | 372164.0 | 2.034438 | 96.375820 |
| 동대문구 | 0.204611 | 0.470588 | 0.250000 | 0.314061 | 0.250887 | 41.090358 | 84.393064 | 100.0 | 100.0 | 87.401884 | 1294 | 369496.0 | 1.490147 | 95.444250 |
| 용산구 | 0.265130 | 0.529412 | 0.250000 | 0.169004 | 0.133128 | 37.700706 | 89.175258 | 100.0 | 100.0 | 83.121951 | 1624 | 244203.0 | 1.346674 | 94.776790 |
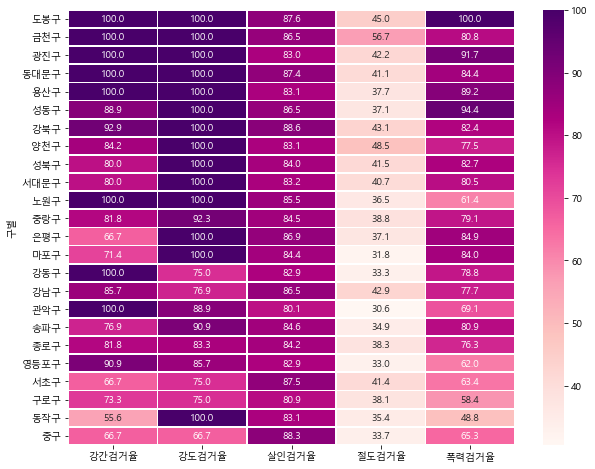
.실습 18. sb.heatmap 을 이용해서 ‘강간검거율’, ‘강도검거율’, ‘살인검거율’, ‘절도검거율’, ‘폭력검거율’ 을 보여주세요. 단, ‘검거’ 로 정렬한 데이터로 보여주세요.
df1 = crime_cctv[['강간검거율', '강도검거율', '살인검거율', '절도검거율', '폭력검거율']]
# 데이터 프레임의 수치를, 바로 색깔의 진하기로 변경하는 히트맵은 , seaborn의 히트맵 함수를 이용
plt.figure(figsize=(10,8))
sb.heatmap(data=df1,cmap='RdPu',annot=True,fmt='.1f',linewidths=0.8)
plt.show()
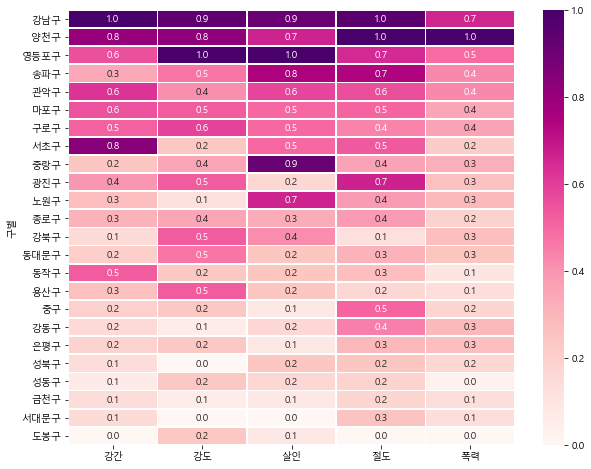
실습 19. 위에서 배운 히트맵을 이용해서, 살기 무서운 구가 어디인지 분석하세요.
df2 = crime_cctv.sort_values('범죄',ascending=False).iloc[:,0:5]
plt.figure(figsize=(10,8))
sb.heatmap(data=df2,cmap='RdPu',annot=True,fmt='.1f',linewidths=0.8)
plt.show()
실습 20. crime_in_Seoul_final.csv 파일로, crime_cctv 를 저장하세요.
crime_cctv.to_csv('crime_in_Seoul_final')
댓글남기기